Key Takeaways
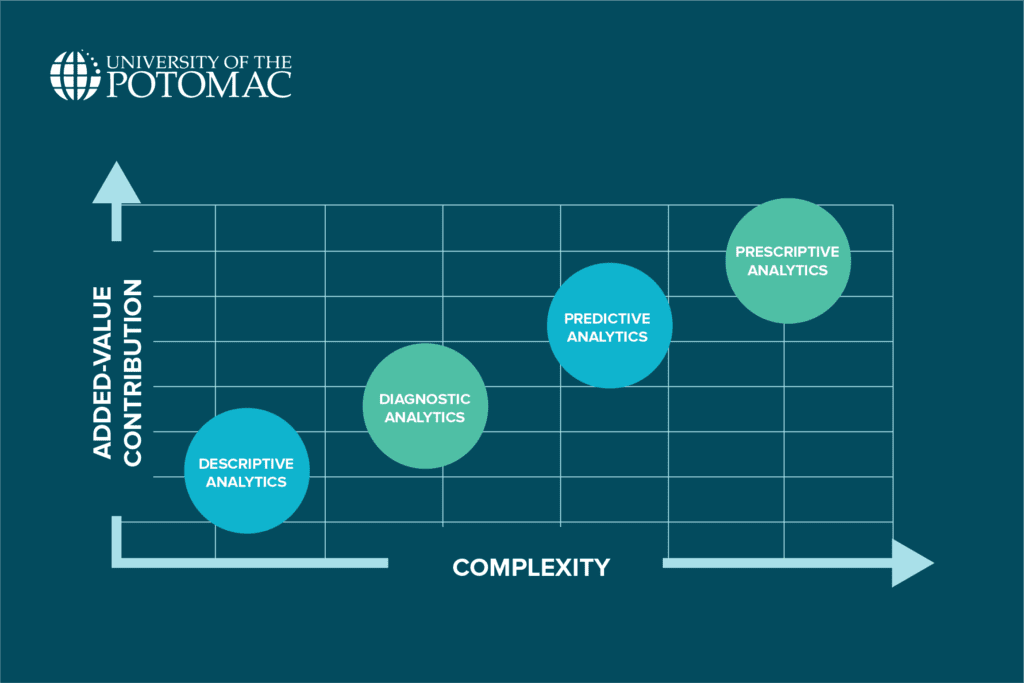
- The main types of big data analytics are descriptive, diagnostic, predictive, and prescriptive analytics.
- Real-time analytics, cognitive analytics, and augmented analytics are some emerging forms of data analysis.
- Understanding big data analytics could help improve decision-making and operational efficiency as well as provide a competitive advantage.
Although the term “big data” is frequently used, it can be difficult to define precisely. Industries, companies, and professionals apply it in different ways. Big data generally refers to two related concepts: extremely large datasets and the specialized computing strategies and technologies required to process them.
Today, it’s estimated that around 402.74 million terabytes of data are created every single day. Managing and making sense of such an enormous volume of information isn’t possible without clear strategies, which is why businesses rely on different types of big data analytics to find meaning and drive smarter decisions.
What Is Big Data Analytics?
If you were running a business and trying to understand your customers’ opinions about a product, it wouldn’t make sense to read millions of reviews one by one from all over the world. However, if you used big data analytics, you could rely on special programs and tools to read through all that information for you, find patterns, like what most people liked or disliked, and provide you with the results.
The process of taking vast amounts of data—far too much for a typical computer or basic program to handle—and using sophisticated tools to analyze it and find the answers you seek is known as big data analytics.
Types of Big Data Analytics
Not all data analytics is the same. Different situations call for different ways of looking at data.
Sometimes, you just want to understand what happened. Other times, you want to figure out why something happened, predict what might happen next, or even decide what you should do about it. That’s why there are several big data analytics types.
Descriptive analytics
In technical terms, descriptive analytics uses historical data to create reports, charts, and dashboards. It’s often the starting point for deeper analysis.
If you were to run an online store, then at the end of each month, you could use descriptive analytics to answer simple but important questions like:
- How many people visited our site?
- How much did we sell this month?
- What were the most common customer complaints?
You can think of it as checking your grades at the end of a semester. You’re not necessarily analyzing why you got an A in English and a C in math; you’re just looking at the results themselves.
Diagnostic analytics
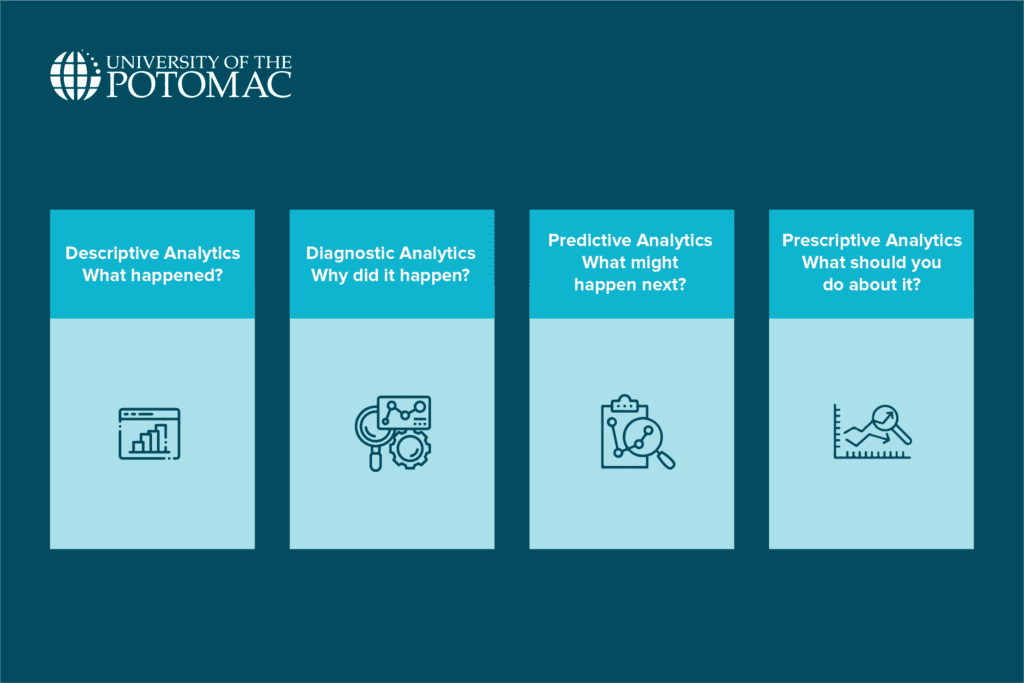
To explore further than the “what” of descriptive analytics, you can use diagnostic analytics and dig into the “why” behind it.
To go back to the online store example, suppose your sales dropped by 20% in March. Descriptive analytics would simply show you that sales went down. But diagnostic analytics would help you explore why that happened. Maybe you discovered that there was a glitch in your website’s checkout page. Maybe customer reviews about a new product were negative, and that scared buyers away.
In diagnostic analytics, you look for patterns, correlations, and causes. You might compare data between months, customer segments, or different products to figure out what went wrong or right.
Think of it like a doctor diagnosing an illness. If you go to the doctor and say, “I have a fever,” the doctor doesn’t just note that, but instead, you get blood tests, questions about symptoms, and maybe even a scan. The goal is to understand the underlying cause so you can treat it properly.
Predictive analytics
Predictive analytics is about looking ahead. It helps businesses guess what could happen in the future based on patterns from the past.
Again, we could use the example of the online store. Suppose you notice that every year, your sales spike during November and December. Based on that pattern, predictive analytics would suggest that you should expect another sales increase during the next holiday season.
However, predictive analytics is more than just guessing. This type uses statistics, models, and sometimes even machine learning to make educated forecasts. For instance, by studying past customer behavior, you might predict:
- Which customers are likely to buy again
- Which products are likely to become bestsellers
- Which customers might stop buying from you soon
It’s the equivalent of weather forecasting. Meteorologists don’t guess when it will rain but make predictions about the weather based on their analysis of past and current patterns. Of course, forecasts aren’t always perfect, but they’re usually good enough to help you decide whether to bring an umbrella.
Prescriptive analytics
Prescriptive analytics takes things even further. Once you have a prediction, this type of analytics helps you decide what to do.
Let’s say your predictive analytics tells you that certain customers are likely to stop buying from your store. Prescriptive analytics could recommend actions like sending them a special discount or personalizing your marketing messages to keep them loyal.
Prescriptive analytics often combines internal data (for example, your own sales records) with external data (like market trends) and uses advanced techniques like machine learning to suggest the best course of action. Sometimes, it even lays out different options and shows the possible results of each choice.
Emerging Types of Analytics
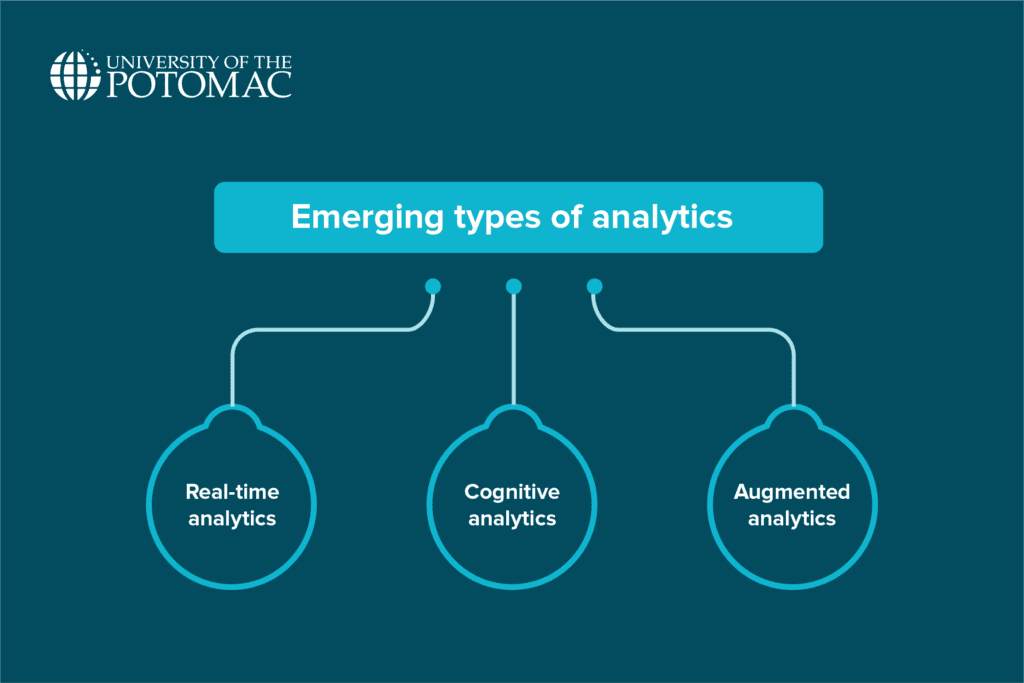
As technology advances and new business challenges arise, new types of analytics have started to emerge. These newer methods build on the traditional four types but push analysis even further. Three important emerging types of analytics in big data include:
Real-time analytics
Real-time analytics is exactly what it sounds like: analyzing data right now as it’s being generated, instead of waiting hours, days, or weeks for a report. It helps companies monitor activities and make decisions on the spot based on live information.
For example, it’s common for websites that sell concert tickets to crash when thousands and thousands of people try to buy tickets at once. These websites’ owners obviously do not want to learn that their system crashed hours later. Instead, through real-time analytics, they can see the traffic spikes and spot system errors immediately so they can fix problems quickly.
Cognitive analytics
Cognitive analytics blends data analysis with concepts from artificial intelligence (AI) like machine learning, natural language processing, and even the general concept of mimicking human thinking.
This type of analytics tries to understand and interpret data more like a human would rather than sorting through numbers like a machine. It is therefore especially well-suited to processing more complicated data and deriving insightful conclusions from it.
For example, if customers are leaving online reviews in different languages with slang, spelling mistakes, and emotional comments, traditional analytics might struggle to work with that data. Meanwhile, cognitive analytics can better read such reviews, as it is more suitable for understanding the tone and detecting common themes.
Augmented analytics
Augmented analytics is the type of analytics focused on using automation to make data analysis faster and more accessible so that even people who aren’t data experts can make sense of it.
Instead of needing a team of analysts to dig through data, augmented analytics tools can be used to automatically clean the data, run analysis, spot patterns, and even suggest next steps.
A marketing manager who isn’t a data scientist could still use this type of analytics tool to find out why sales dropped last month, as the systems would automatically pull relevant data, run diagnostic analytics, and suggest that a pricing change may have led to fewer sales. All this would be done without needing complex manual analysis.
Benefits of Understanding Big Data Analytics Types
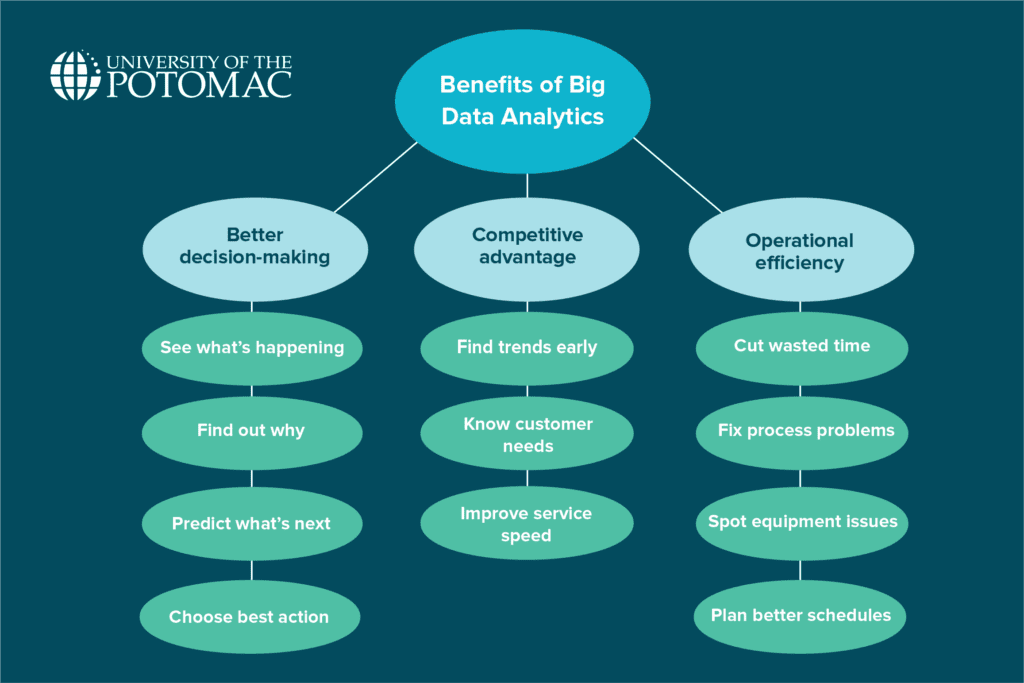
Knowing the different types of big data analytics and when to use them brings major advantages. It’s all about making smarter choices and staying ahead of competitors. The difference can be best observed through:
Better decision-making
When you understand the types of big data analytics, your decisions don’t have to rely on gut feelings or guesses.
- Descriptive analytics gives you the facts about what’s happening.
- Diagnostic analytics explains why things are happening.
- Predictive analytics helps you prepare for the future.
- Prescriptive analytics tells you the best steps to take next.
With all these tools available, you can base every decision on solid evidence. You’ll be better equipped to make informed choices that help move your goals forward.
Competitive advantage
Businesses that understand their data have a real edge over those that don’t. In fact, companies that effectively use their data are 23 times more likely to acquire customers, six times more likely to retain them, and 19 times more likely to turn a profit compared to their competitors.
Therefore, by using big data analytics to their benefit, companies can:
- Spot market trends early
- Predict customer needs before competitors do
- Offer better, faster, and more personalized services
Think of it like this: there are two companies selling the same product, and one of them waits for sales reports every quarter to make changes, whereas the other uses real-time analytics and predictive modeling to adjust pricing, recommend products, and respond to trends instantly. Naturally, the second company will be better positioned to win customer loyalty and outperform its competition.
Operational efficiency
Big data analytics can also lead to a smoother, smarter business in general, as by analyzing operations through different types of analytics, companies can:
- Identify wasteful processes
- Find bottlenecks in production or service delivery
- Predict equipment failures before they happen
- Optimize staffing based on busy periods
For example, predictive analytics might help a factory know when a machine is likely to need maintenance, avoiding costly breakdowns. Descriptive analytics could reveal which areas of a company’s logistics system are consistently causing delays.
Conclusion
Pursuing a career in data analytics, especially one focused on big data, is definitely a smart choice. Gaining expertise in the various forms of data analytics would enable you to assist companies in interpreting the vast volumes of data they collect on a daily basis.
The best way to prepare for this exciting field is through education. At the University of the Potomac, our Data Analytics MA program is the perfect option to help equip you with both the technical knowledge and the practical skills needed for a data analytics career. You’ll learn how to work with big data tools, apply different types of analytics, and, most importantly, use data to read the present, understand the past, anticipate the future, and guide your business toward success.
Frequently Asked Questions
What skills are needed to work in big data analytics?
Skills like data analysis, statistical thinking, programming, critical thinking, and the ability to work with big data tools are some of the most important for a career in big data analytics.
What are some common tools used in big data analytics?
Some common tools include Hadoop, Spark, Tableau, Power BI, Python, and R, as well as cloud platforms like AWS and Google Cloud for data processing and analysis.